HBDI Molecule Dynamics
I used spectroscopy data to understand the photochemistry of a small molecule.
Introduction
HBDI is small molecule that is the model chromophore of the Green Fluorescent Protein (GFP). In other words, HBDI is fragment responsible for fluorescence in GFP. When this molecule is not inside the protein, it is not fluorescent because it lacks the protein environment that facilitates fluorescence. I studied the alternative pathways this molecule takes when exposed to light. I relied on a technique called femtosecond stimulated Raman spectroscopy (FSRS), which can the reveal the ultrafast molecular motions at the moment a molecule is struck with a photon.
Frequency Analysis
FSRS captures the Raman spectrum at several time deltas from the start of the photoexcitation reaction, capturing structural clues of the reaction through time. One of the challenges of this technique is processing and interpreting the large amount of data that it generates. For instance, one of the first processing steps is removing the large, non-linear baselines that are present in this data. The figure below shows the spectrum before and after baselines are removed.
Once these baselines are removed, the exponential decay time dynamics of the peaks become visible. Interestingly, there are also oscillations modulating these peaks, finding and characterizing them was a major focus of the project. These oscillations are interesting because they provide valuable information about how low frequency vibrational modes interact with other modes, which are important to understanding the photochemical reaction.
To see these oscillations, the exponential time dynamics of each of the peaks needs to be removed. One approach is to fit one or several “bell curves” to each peak of interest. The difference between the fitted model and the signal would contain the oscillations. This approach, however, has the drawback of being time consuming and being limited in scope to the chosen peaks. I set out to create an approach that would simultaneously be faster and reveal oscillations for the entire spectrum in one pass.
I relied on a technique called Global Analysis, which models the spectrum as a series of separable non-linear models. It is commonly used for other types of spectroscopy such as transient absorption spectroscopy, but had not been applied to FSRS data because its spectra a typically too complex to accurately model with Global Analysis. The model, however, can produce a reasonable estimate of a spectrum’s exponential time dynamics, even if its fitted parameters are less meaningful. I used Glotaran, a GUI interface to create Global Analysis models, to generate an approximate model for the spectrum. Finally, a Fourier transform of the residuals revealed a key oscillation at the 867 cm-1 mode (figure to the left).
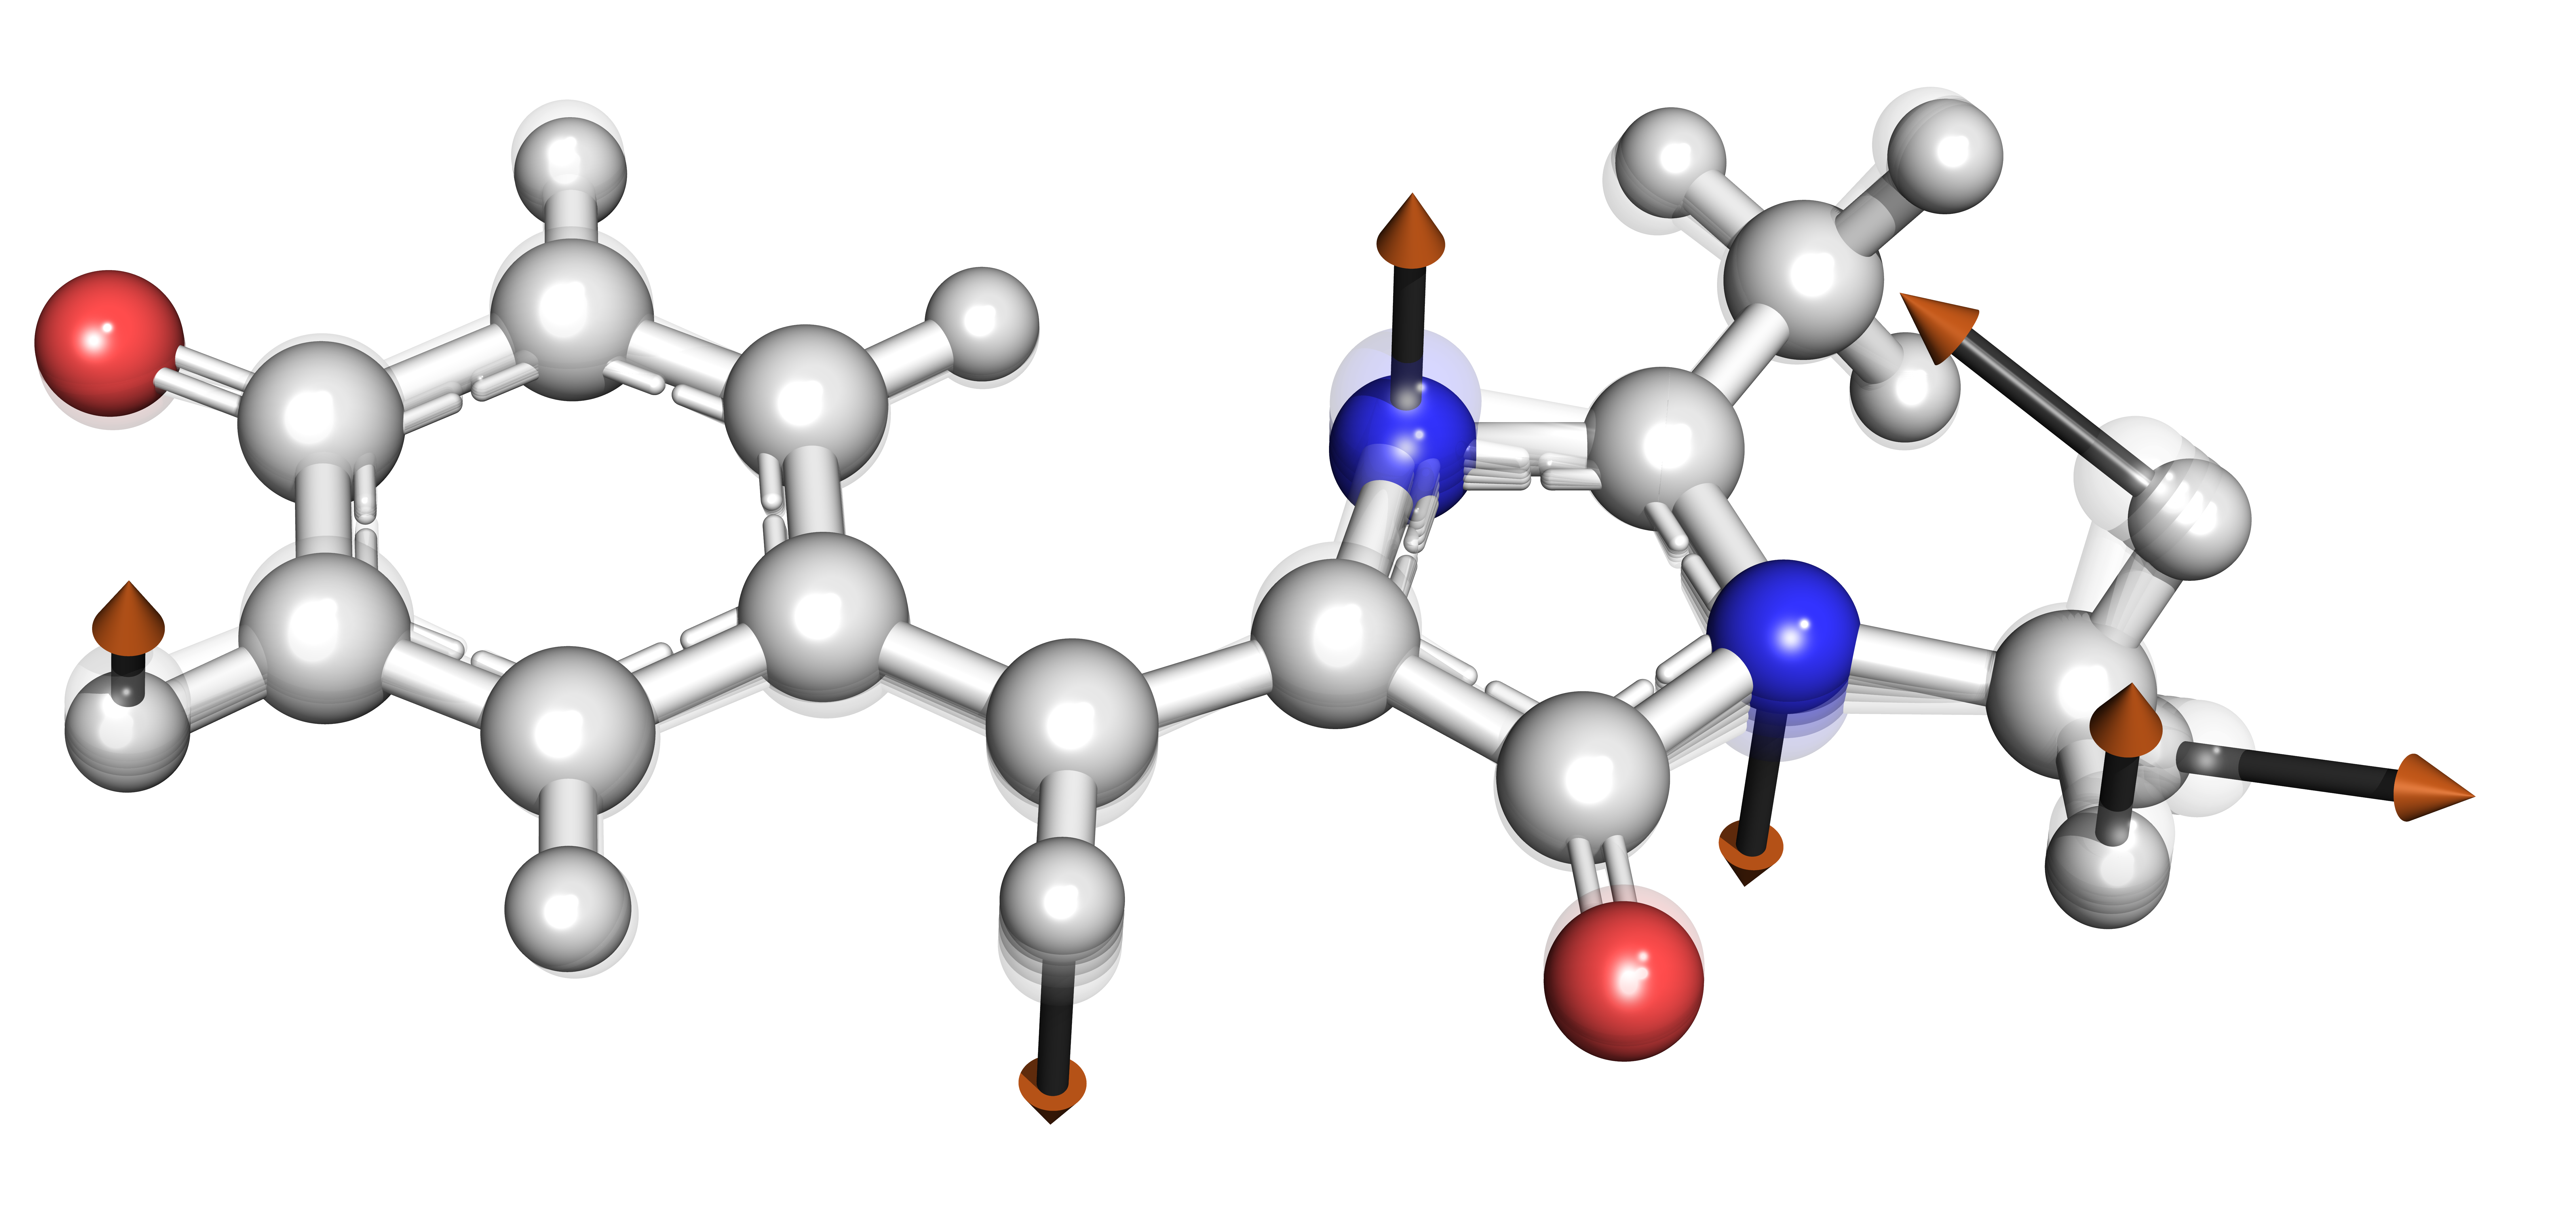
The 232 cm-1 frequency that is visible in the Fourier transform corresponds to a whole-molecule twisting motion, indicating that this motion is happening during the chemical reaction.
Wavelet Transform
Going even further, I introduced the wavelet transform as a method to gain more insight into this oscillation. A wavelet transform provides a breakdown of the frequencies that are present as a function of time. The transform of the 867 cm-1 mode is shown in the right figure above. The figure shows that the 232 cm-1 mode emerges at a delay 0.5 ps after photoexcitation and reaches a maximum at around 0.9 ps. This insight supports the hypothesis that there is an intermediate state in the photochemical reaction, something that is corroborated by other evidence in the study.
Conclusion
In conclusion, the Fourier transform provided important evidence that revealed an important oscillation that corresponded to an important twisting motion that is shown below.

The subsequent wavelet transform of the 867 cm-1 peak showed that the twisting motion appears after a 0.5 ps delay after photoexcitation, which supported the hypothesis that the molecule proceeded through an intermediate state. The technique that I used can be applied to study other systems, and the OscillationsApp project page has more details about the interactive web application that simplifies the data analysis. Additionally, the poster below provides more details regarding the project.

